
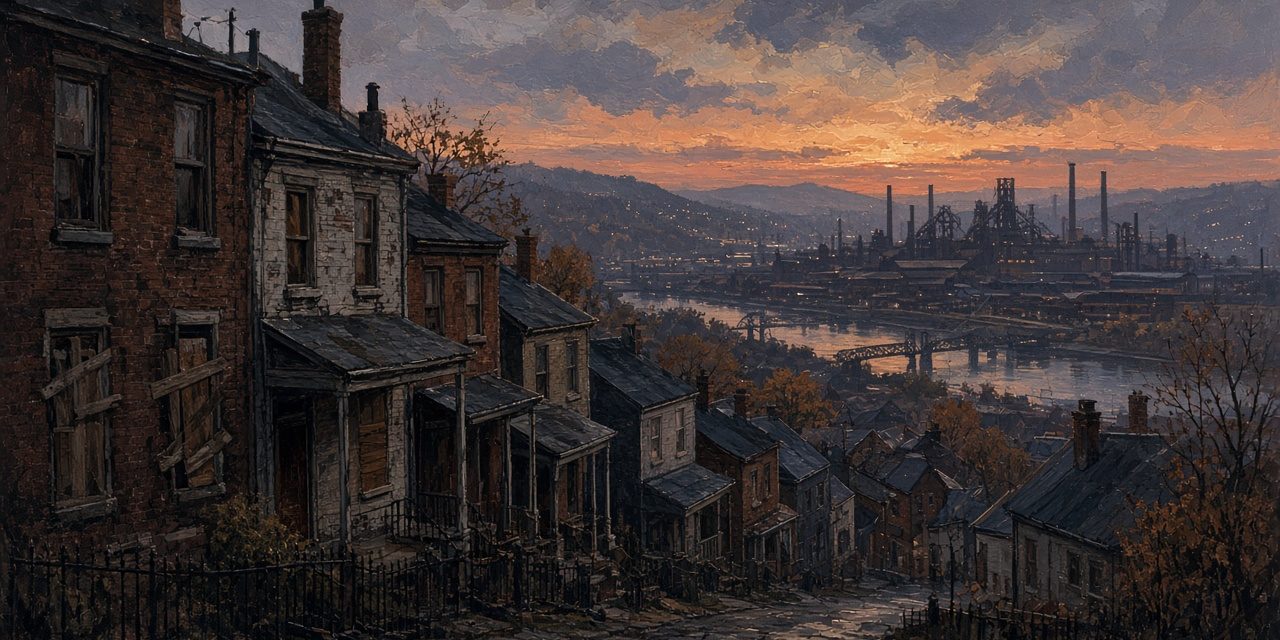
The Pittsburgh population decline is one of the steepest of any big American city: the 1950 census counted 676,806 people in the city, and the 2020 census counted 302,971, a loss of more than half. It did not happen all at once, and it did not have a single cause. The city stopped growing before World War II, lost residents to its suburbs in the 1950s and 1960s, then lost them to other regions entirely when the steel industry collapsed in the early 1980s. Here is what the census counts show, decade by decade, and what researchers say drove each stage.
The numbers, census by census
The U.S. Census Bureau’s historical tables of the nation’s largest cities, compiled by Campbell Gibson in 1998, give Pittsburgh’s population and its national rank at every census through 1990. The 2000 count and rank come from the Census Bureau’s 2000 ranking of incorporated places, and the 2010 and 2020 counts from its QuickFacts.
- 1920: 588,343 (9th largest U.S. city)
- 1930: 669,817 (10th)
- 1940: 671,659 (10th)
- 1950: 676,806 (12th) — the peak
- 1960: 604,332 (16th)
- 1970: 520,117 (24th)
- 1980: 423,938 (30th)
- 1990: 369,879 (40th)
- 2000: 334,563 (53rd)
- 2010: 305,704
- 2020: 302,971
The 1960, 1970 and 1980 counts each show a loss of more than 10 percent, and the drop from 1970 to 1980 alone was nearly 100,000 people. That took Pittsburgh from 12th largest in 1950 to 53rd in 2000, according to the Census Bureau’s 2000 ranking of places of 100,000 or more. (A 2013 article in Western Pennsylvania History magazine gives 51st, but the Census table is the official ranking.)
The plateau came first
The most surprising part of the story is that Pittsburgh’s growth stopped long before the decline began. The University of Pittsburgh’s University Center for Social and Urban Research (UCSUR), in a 2024 report on the city’s neighborhoods, puts it plainly: “The City of Pittsburgh’s population had effectively plateaued decades before 1950.” Between 1930 and 1940, the city gained only about 1,800 people, under 0.3 percent, and UCSUR says that gain was “mostly attributable to territorial annexations of neighboring municipalities.” Growth in the 1940s, it adds, came mostly from “wartime housing projects rapidly constructed during the war including those in Glen Hazel.”
That matters because the 1950 peak is often treated as the high-water mark of a booming city. In UCSUR’s account it was closer to the top of a flat line, propped up by annexation and wartime housing. Once those effects ended, the forces that had been holding the city’s population steady began to pull it down.
Boundaries that stopped moving
Pittsburgh’s land area barely changed after 1950, and that shaped how the decline looks on paper. The Census Bureau’s tables put the city at 54.2 square miles in 1950 and 55.6 in 1990. Earlier, annexation had been a big part of the city’s growth: the same tables note that Pittsburgh annexed the city of Allegheny, today’s North Side, in 1907, and the city covered 39.9 square miles in 1920 and 51.3 in 1930.
The Census Bureau’s own explanation of its tables says that population rankings are “based on the boundaries of cities … at the time of each census,” and that “growth in city populations has been due partly to annexations of surrounding territory.” Cities that kept annexing their suburbs could show growth even as people moved outward; cities with fixed boundaries, like Pittsburgh after the 1950s, recorded each move to the suburbs as a loss. In 1990, the Census Bureau’s tables show, Pittsburgh ranked 40th among cities but its urbanized area, city plus surrounding suburbs, ranked 20th, with about 1.68 million people. The region was much bigger than the city’s count suggested.
Stage one: the move to the suburbs (1950s–1970s)
The first wave of losses was mostly local. The Western Pennsylvania History article describes a population that, “after peaking in the 1950s, began a slow decline exacerbated by suburban flight and the economic turmoil of the 1970s.” It adds a second factor: “the influx of immigrants stalled, further contributing to a declining urban population.”
A dissertation on public policy and the postwar suburbanization of Pittsburgh from 1945 to 1990 found the same pattern in Allegheny County’s roughly 130 municipalities. Its abstract says that “after 1945, the suburbs grew rapidly while central cities lost population,” and that “high-income suburbs grew the most, while low-income urban areas experienced the greatest decline.” It argues that federal, state and local policies had “a much greater influence on postwar suburbanization, and especially the structure of the suburbs,” than before the war.
Redevelopment in the city also moved people out. The clearance of the Lower Hill District for the Civic Arena displaced roughly 8,000 residents, the figure the Heinz History Center and the Post-Gazette use, as the SteelCityHistory history of the Lower Hill demolition explains. The Post-Gazette reported that the city housing authority planned to relocate 1,551 families, 29 percent of them into public housing, according to the same account.
How people got around changed as well. Streetcar ridership peaked in 1920, when the city’s population was 588,343, WESA has reported, and the network shrank over the following decades; the SteelCityHistory history of Pittsburgh’s lost streetcar network traces that story.
Stage two: steel collapses (the 1980s)
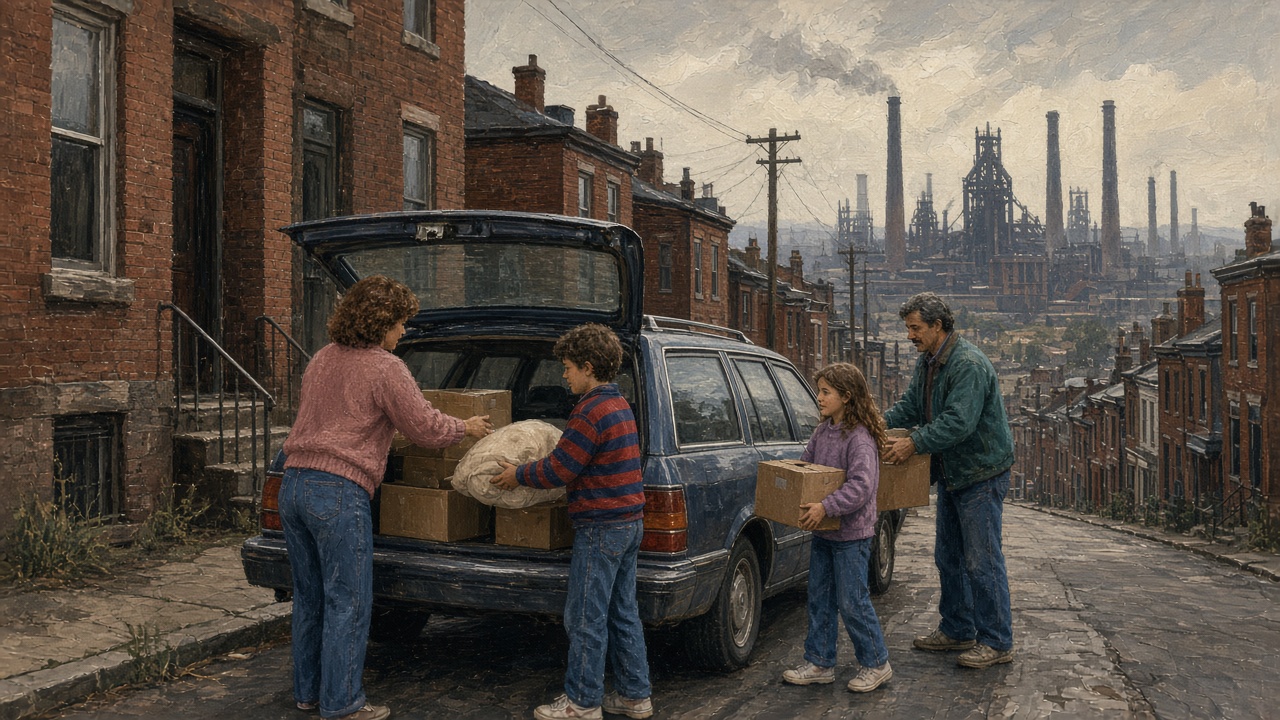
The second wave was regional, and it was caused by jobs. In a 2014 analysis for UCSUR’s Pittsburgh Economic Quarterly, titled “How Many People Left Pittsburgh During the 1980s?”, economist Christopher Briem wrote that the number of manufacturing jobs in a 10-county Southwestern Pennsylvania region fell “by more than 44 percent, from more than 304,000 in 1979 to just less than 169,000 in 1986.” The unemployment rate in the Pittsburgh metropolitan area “spiked to more than 18 percent in January 1983,” he wrote, and Beaver County peaked at more than 28 percent the same month.
People left to find work. Briem estimated, using county migration data compiled by demographers Glenn Fuguitt and Calvin Beale, that net migration out of the 10-county region during the 1980s totaled 227,039 people, “approximately 8 percent of the region’s population in 1980.” Allegheny County alone lost a net 123,440 people to migration. The Pittsburgh metropolitan area “saw its total population decline by a larger number than any other metropolitan region over the course of the 1980s,” he wrote, and that happened even though births outnumbered deaths in the region during the decade.
The people who left were young. Briem found that 118,095 of the region’s net migrants, more than half, were between 20 and 34 years old in 1980. Among the 20 biggest metro areas, only Detroit lost more people in their 20s than Pittsburgh’s 74,852, and Pittsburgh’s loss was by far the steepest relative to its size: 190 per 1,000, against 129 in Cleveland and 94 in Detroit. A 2018 Federal Reserve Bank of Cleveland report on Pittsburgh, “Rust and Renewal,” quoted a 2012 Post-Gazette retrospective that put it bluntly: unemployment came down after January 1983 “not because people were returning to work here but because the young and able-bodied left the region, and thus its labor force.”
The Cleveland Fed report adds national context. Employment in blast furnaces and basic steel products fell by about 300,000 workers nationally during the 1980s, “more than half the industry’s total workforce, many of whom were employed in the Pittsburgh MSA.” It says the metro area’s population fell from about 2.75 million in 1970 to about 2.35 million, with the 1980s decline, close to 200,000 people or about 7 percent, “the steepest decline in population among the nation’s 50 largest metro areas during that decade.” For the mills themselves and why they closed, see the SteelCityHistory history of the rise and fall of Pittsburgh’s steel industry and the SteelCityHistory look at the Mon Valley steel towns.
Stage three: a smaller, older region (1990s–2000s)
The losses slowed after the 1980s but did not stop. The city lost about 35,000 people in the 1990s and about 29,000 in the 2000s, according to the census counts above. The Cleveland Fed report says that “though the Pittsburgh MSA’s population declines intensified in the 1980s, they continued” in later decades, and it found that from 1980 to 2010 the metro area’s population fell by 0.4 percent a year while the nation’s grew by 1.0 percent. That gap in population, the report argues, accounts almost entirely for why personal income in the region grew so much more slowly than the nation’s over the same period.
Part of the later decline was an echo of the 1980s. Briem’s analysis noted that the population losses “extended through subsequent decades that generated continued impacts on employment and population.” A separate UCSUR migration study by Briem found that between 2000 and 2006, 216,738 people moved into the Pittsburgh metropolitan area and 251,179 moved away, a net domestic loss of 34,441.
Why the region lost more than the city’s numbers show
It is easy to read the city’s count as the whole story, but the 1980s losses were regional. Briem’s table shows every county in the 10-county region losing population to net migration in that decade, from Butler, with a net loss of 2,941, to Allegheny, with 123,440. Measured against their 1980 populations, Lawrence and Beaver counties lost the most: about 113 and 106 people per 1,000 residents, respectively. In other words, the losses of the 1980s were spread across the whole region, not concentrated in the city.
Has the decline stopped?
The most recent counts suggest the city has leveled off. The 2020 census counted 302,971 people, down 2,733 from 2010, a 0.9 percent drop, much smaller than any decade since 1950. UCSUR says nearly all of that loss came from a shrinking prison population: the number of people in correctional facilities in the city fell by 2,574 during the decade, including the 2017 closure of the state prison in Brighton Heights, the former Western Penitentiary. Excluding them, UCSUR says, the city’s noninstitutionalized population “showed a slight net increase between 2010 and 2020 for the first decade since the 1940s.”
The Census Bureau’s annual estimates point the same way. QuickFacts lists an estimated 307,632 residents on July 1, 2025, up 1.5 percent from the 2020 estimates base. Estimates are not counts, and UCSUR cautions that the city’s apparent stability “masks ongoing and significant changes in the characteristics of the city’s resident population, and disparate patterns of change across city neighborhoods.”
Common questions
When was Pittsburgh’s population highest?
In 1950, when the census counted 676,806 residents. UCSUR notes the figure is “typically cited” as the peak and that the city had effectively plateaued since about 1930.
How much population has Pittsburgh lost?
From 676,806 in 1950 to 302,971 in 2020, a loss of 373,835 people, or about 55 percent.
Did the steel industry cause Pittsburgh’s population decline?
It caused the sharpest part of it. The city had been losing residents to its suburbs since the 1950s, but the collapse of manufacturing in the early 1980s drove people out of the region altogether. The Pittsburgh metro area lost more people in the 1980s than any other U.S. metro, according to UCSUR and the Cleveland Fed.
Is Pittsburgh’s population growing again?
Slightly, according to Census Bureau estimates since 2020, and UCSUR found the city’s population outside prisons grew a little between 2010 and 2020. The 2030 census will be the next full count.
For the city’s longer story, from the forts to the mills to the hospitals and universities, see the SteelCityHistory timeline of Pittsburgh’s history.